 J.B. Hunt is still expecting a good finish to 2022. (Photo: Jim / )
Management from J.B. Hunt Transport Services acknowledged an inflection point in freight fundamentals on its second-quarter call with analysts Tuesday night, but said that most of its customers are still expecting a good finish to 2022.
“We’re having a seasonally normal July,” Chief Commercial Officer Shelley Simpson said on the call. “We do think that there will be a peak [season], to what extent we’re still not sure. We feel confident in the different areas of our businesses and how we’re having conversations with our customers.”
She noted that the company is still navigating supply chain bottlenecks, mostly at the ports and on the rails, and that labor availability remains a headwind. She said there was some dislocation in the inventories that customers are holding but it appears to be a short-term issue tied to out-of-season items.
“I think our customers are prepared to have a good second half. I haven’t had a lot of feedback on a significant downturn,” Simpson continued.
Consolidated revenue of $3.84 billion was 32% higher y/y and 21% higher excluding fuel surcharges. Operating income jumped 46% to $353 million.
 Table: J.B. Hunt’s key performance indicators – Consolidated
Intermodal takes share amid network congestion
Rail service issues remained a headwind to intermodal volumes but J.B. Hunt continued to outperform the market. Intermodal loads were 8% higher y/y compared to a 5% decline in intermodal traffic on the Class I railroads. Volumes accelerated throughout the period: up 4% y/y in April, up 9% in May and 10% higher in June.
The number of loads per J.B. Hunt container was only off slightly y/y during the quarter at 5x, a slight improvement from the 4.8x recorded in the first quarter.
Intermodal revenue increased 42% y/y to $1.83 billion. Revenue per load was up 32% with cost per load climbing 31%. Excluding the impact of fuel surcharges, revenue per load increased 20% y/y. The operating ratio improved 60 basis points to 88.9%. The result included $7.7 million in net insurance-related expenses.
“Collectively, us and our rail providers all understand that there’s additional demand, additional revenue and additional volume waiting on us to improve our service,” Darren Field, president of intermodal, stated. “I do anticipate that we’re going to see some improvements during the second half of the year.”
 Table: J.B. Hunt’s key performance indicators – Intermodal
Dedicated seeing no demand weakness
“We talked last quarter about seeing solid momentum in the business, and that remains the case today as we continue to onboard new business,” said Nick Hobbs, COO and president of contract services.
The dedicated unit has added nearly 2,200 revenue-producing trucks over the past year. Second-quarter revenue increased 39% y/y to $863 million as loads were up 13% and revenue per truck per week was up 14%. Excluding fuel surcharges, revenue per truck per week was up 5%. The impact from higher rates was partially muted as new customer startup costs provided an overhang.
The division’s OR deteriorated 240 bps to 89.7% due to wage and comp increases, recruiting expenses, new account startup costs, and an uptick in bad debt expense, among other items. Higher fuel prices presented at least a 100-bp headwind to dedicated margins in the period, management said.
 Table: J.B. Hunt’s key performance indicators – Dedicated
Brokerage, truckload and final-mile contribute to revenue and operating income growth
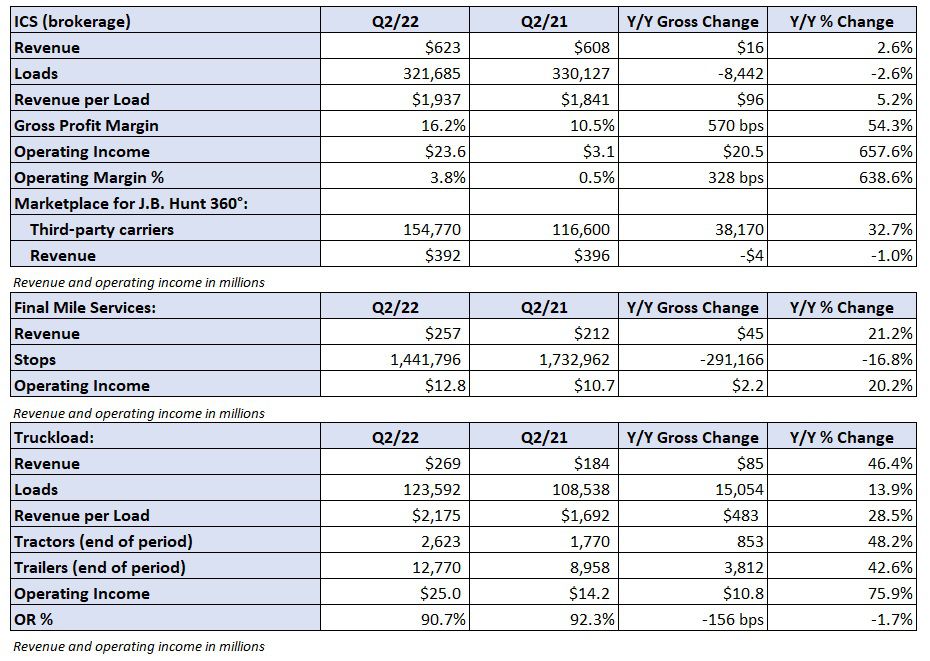
Brokerage revenue was up 3% y/y to $623 million. Loads were down 3% but revenue per load increased 5%. The biggest decline in volumes occurred in April, with load counts improving since. Of note, brokerage revenue did decline 1% y/y on the 360 platform. The division’s gross margin improved 570 bps to 16.2% and operating income was 8 times higher at $24 million. The result included $6.7 million of net pretax insurance expense.
Final-mile revenue increased 20% with operating income up by a similar amount at $13 million. Truckload revenue increased nearly 50% with a 90.7% OR, 160 bps better y/y.
 Table: J.B. Hunt’s key performance indicators – Brokerage, Final-mile and Truckload
More articles by Todd Maiden


