Clarkson Research recently released its mid-year review of the shipping market. Steve Gordon, its Global Head, noted that the ClarkSea Index—a key indicator of charter rates—declined by only 5% year-on-year in the first half of the year, averaging $24,101 per day. While the container shipping market surged by 79%, other segments saw declines: tankers (-33%), dry bulk (-31%), and LPG transport (-22%). Excluding container shipping, the ClarkSea Index fell by 31% year-on-year.
Over the past six months, market dynamics have grown increasingly complex, with the shipping industry continuing to face geopolitical disruptions. Global seaborne trade volume remained steady at 12.6 billion tons annually, but growth varied significantly across segments due to slowing global economic growth and U.S. tariff policies.
Newbuilding orders dropped by 54% year-on-year, cooling sharply from 2024 levels, while secondhand vessel transactions proved more resilient, declining by 16%. Global shipbuilding capacity remained stable (China: 48%, South Korea: 31%, Japan: 13%), but China’s share of new orders fell to 52%, down from 70% in 2024.
Global fleet capacity growth remains below long-term trends, with expectations of increased scrapping and aging vessels driving renewal demand.
//-Segment Review-//
Container shipping remained strong, though growth in other key segments slowed after the first half of 2024.
Tankers: Average earnings held steady at $29,692 per day in H1, 23% above the 10-year average, supported by limited fleet growth and longer Russia/Europe routes. However, earnings fell 33% compared to H1 2024 (when Red Sea diversions boosted product tanker rates). In June, VLCC rates briefly hit a two-year high of $70,000/day due to Iran-Israel tensions before normalizing. OPEC+ production cuts easing could lift H2 performance.
Chemical Tankers: The chemical tanker index fell 9% year-on-year, weighed by weak CPP demand and slowing Chinese imports.
LPG: VLGC rates softened, with Middle East-Japan spot rates down 22% to $38,902/day. Panama Canal transits improved from early 2024, while U.S. exports faced capacity constraints. U.S.-China tariff hikes caused volatility, but trade (13% of global LPG flows) held steady. U.S. ethane exports to China (half of global volumes) paused in June, though recent talks suggest easing restrictions. VLGCs showed relative strength mid-year.
LNG: Spot rates for 174,000 cbm LNG carriers averaged $24,606/day, down 56%, pressured by fleet growth, project delays, and more U.S. cargoes heading to Europe over Asia. Long-term LNG trade growth remains positive. Steam turbine LNG carriers now make up 25% of the fleet, with new orders accounting for 44%.
Offshore: Charter rates have retreated from peaks but remain 60% above long-term averages, with strong regional variations (notably Brazil). Segments diverged—while 2025 demand is weak, owners and charterers are optimistic about 2026, as seen in firm contracts for floating rigs starting H2 2026. Offshore wind vessel rates remain firm.
Dry Bulk: Average earnings fell 31% year-on-year to $10,897/day (though H1 performance was still solid). Rates are 18% below the 10-year trend due to weak Chinese raw material demand and high inventories. Guinea bauxite exports and port congestion drove a Q2 Capesize rebound—a rare bright spot.

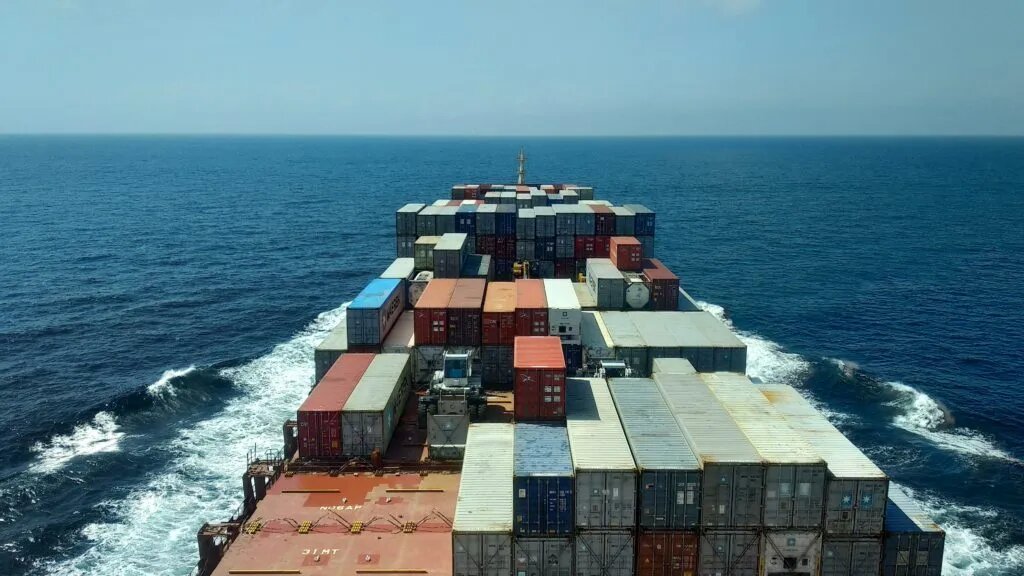
Containers: The market shrugged off tariff concerns and fleet expansion, sustaining last year’s rate gains. H1 charter rates rose 80% year-on-year, 80% above the 10-year average, with Red Sea diversions still supporting. Though rates are above trend, trans-Pacific volatility persists due to U.S.-China trade tensions.
Car Carriers: Rates remain volatile amid faster fleet growth and slowing demand but stay above long-term trends. Average annual rates for 6,500 CEU vessels were $55,000/day in H1, down 50% from 2024 records but still 32% above the 10-year average.
Global fleet growth remains moderate at ~3.5% year-on-year, but structural gaps persist: LNG, container, and car carrier orders are active, while crude tanker orders lag. Newbuild prices dipped 1% in H1, though the price index is 29% above the 10-year average. Long-term renewal, decarbonization, and financing needs remain strong, with the global fleet and orderbook valued at $2.1 trillion.
Scrapping stays weak—H1 demolitions totaled just 5 million dwt, 59% below long-term trends, offering some “release valve.” Meanwhile, tighter sanctions exacerbate the backlog of aging vessels and “shadow fleet” tonnage.
Secondhand sales slowed to $19 billion (56+ million dwt), down 15% year-on-year. Older tanker and bulk carrier prices weakened, while modern vessels held steady or gained slightly. Container ship prices stabilized.
Alternative fuels accounted for 55% of new orders (by GT) in H1, with LNG still dominant. Energy-saving technologies (ESTs) now feature on over 12,400 vessels (42%+ of global fleet tonnage).
FuelEU Maritime took effect in early 2025, with standards set to tighten. Under IMO, consensus on “mid-term measures” aims to accelerate decarbonization via economic and technical levers.
Source: Clarkson Research


