

In the first half of 2025, container handling at ports in Santa Catarina rose 12.5% compared with the same period last year. Terminals in the state moved 1.38 million TEUs from January to June, according to data from the National Agency for Waterway Transportation (Antaq). The volume represents 18.9% of Brazil’s total containerized cargo movement.
However, container traffic in June alone decreased by 6.5% year-over-year, reaching 216,700 TEUs. “The figures reflect the advance stocking by U.S. buyers in previous months, who increased their inventories amid tariff uncertainty,” said FIESC Chief Economist Pablo Bittencourt.
Antaq data supports this view. Key export products from Santa Catarina showed declines in June: sawn timber over 6mm thick fell 36% in volume, plywood and laminated wood dropped 8%, and the volume of meat and edible offal decreased 28.3%.
Bittencourt noted that exports of wood and wood products are driven by the U.S. residential construction market, which has been slowing since at least May. “June’s decline also partly reflects earlier stockpiling,” he added.
Ports
Year-to-date through June, the Port of Itapoá recorded a 30.6% increase in container throughput, reaching 741,350 TEUs and ranking third nationally. Portonave experienced a 20.7% drop to 484,300 TEUs, while the Port of Itajaí continued expanding, handling 103,900 TEUs in the first half. Combined, the Itajaí port complex—which includes the ports of Itajaí, Navegantes, and Barra do Rio—reached 588,300 TEUs, placing it fourth in the country. Container handling at the Port of Imbituba rose 4.6% to 52,240 TEUs.
Below is a historical overview of exports from the ports of Itapoá, Portonave, Itajaí, and Imbituba from January to June 2024. The chart was prepared using data from DataLiner:
SC Ports Export TEUs | Jan–June | 2024
Source: DataLiner (Click here to request a demo)
Below is a historical overview of exports from the ports of Itapoá, Portonave, Itajaí, and Imbituba from January to June 2025. The chart was prepared using data from DataLiner:
SC Ports Export TEUs | Jan–June | 2025
Source: DataLiner (Click here to request a demo)
Below is a table detailing different ports from Santa Catarina and the number of TEUs handled from January to June of both 2024 and 2025, along with a corresponding percentage increase or decrease from one year to the next:
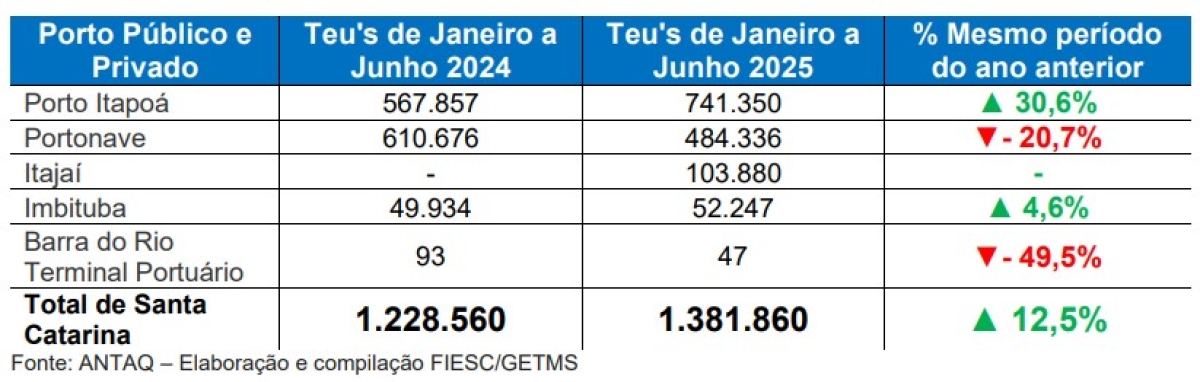
Source: Informativo dos Portos
