Spot fixtures
The latest estimates show global spot fixtures declined in March, averaging of 13.8 mb/d. Fixtures fell 1.3 mb/d, or around 9% m-o-m. Compared with the previous year, spot fixtures were down 2.3 mb/d, or 14%.
 In contrast, OPEC spot fixtures saw a slight increase m-o-m in March, averaging 9.4 mb/d, representing an increase of less than 1%. Compared with the same month in 2021, they were about 1.0 mb/d, or 10%, lower. Middle East-to-East fixtures increased 0.2 mb/d or 4%, to average 5.5 mb/d. Compared with the same month last year, eastward flows were 0.5 mb/d, or about 8%, higher. Spot fixtures from the Middle East-to-West declined by about 0.2 mb/d or 13% m-o-m in March, to average just under 1 mb/d. Y-o-y, rates were 0.3 mb/d or 41% higher. Outside the Middle East, fixtures averaged 2.9 mb/d in March. This represents a marginal decline m-o-m and a more substantial 0.8 mb/d or 22% decline y-o-y.
Sailings and arrivals
OPEC sailings declined by 1.1 mb/d or about 5% m-o-m in March to average 22.2 mb/d. OPEC sailings were 0.8 mb/d, or around 4%, higher compared with the same month of the previous year. Middle East sailings declined by almost 0.5 mb/d or around 3% m-o-m in March to average 17.1 mb/d. Y-o-y, sailings from the region rose 1.6 mb/d, or around 11%, compared with March 2021. Crude arrivals were saw gains across most regions in March, with just Europe seeing a marginal decline. Arrivals in the Far East increased 1.2 mb/d, or around 9%, m-o-m to average around 15.0 mb/d. Y-o-y, arrivals were 3 mb/d, or about 27%, higher.

In West Asia, arrivals increased 1.3 mb/d, or 15%, m-o-m in March to average 9.7 mb/d, representing a y-o-y increase of 3.5 mb/d, or 56%. Arrivals in North America increased 0.4 mb/d, or over 4%, to average 9.0 mb/d, representing a y-o-y rise of almost 1 mb/d or 12%. Arrivals in Europe edged down slightly to average 12.9 mb/d. However, this was almost 1 mb/d, or about 8%, higher than in the same month last year.

Dirty tanker freight rates
Very large crude carriers (VLCCs)
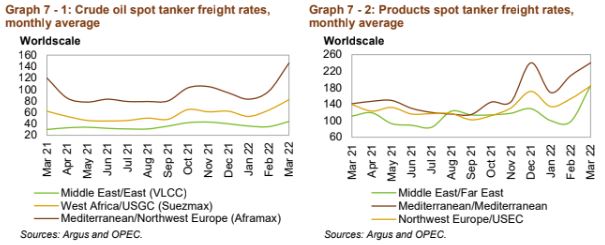
After many stagnant months, VLCC spot rates finally registered a noticeable increase in March, gaining 28% on average m-o-m, with rates moving higher across all reported routes compared to the previous month. Gains were supported by improving sentiment amid an expected increase in demand for long haul routes, as well as a need to quickly shift toward alternate supply. Rising bunker fuel prices also pressured rates higher. On the Middle East-to-East route, rates rose 26% m-o-m to average WS44 points and were 47% higher y-o-y. Rates on the Middle East-to-West route also increased, up 35% m-o-m to average WS23 points. This represented a y-o-y gain of 10%. West Africa-to-East spot rates rose 22% m-o-m to average WS44 in March. Compared with the same month last year, rates were 26% higher

Suezmax
Suezmax rates saw a second month of gains in March, rising 23% m-o-m. Y-o-y, rates were 32% higher. The increase was driven by strength in the Atlantic basin, amid increased flows to Europe. Rates on the West Africa-to-US Gulf Coast (USGC) route increased by 28% m-o-m in March to average WS82. Compared with the same month last year, rates were 32% higher. Spot freight rates on the USGC-to-Europe route rose 20% over the previous month to average WS77 points. Y-o-y, rates were 31% higher.

Aframax
Aframax spot freight rates showed a continued strong performance in March. On average, spot Aframax rates were 38% higher m-o-m. Compared with the same month last year, rates were 30% higher. Disruptions in the Black Sea contributed to the increase in spot freight rates. Global traders are reportedly avoiding chartering vessels from Russia’s top shipping company Sovcomflot, which has one of the largest Aframax fleets in the world. This effectively reduced availability, thus supporting prices.
Rates on the Indonesia-to-East route increased 46% in March compared to the same month last year, averaging WS134. However, m-o-m, rates on the route rose 51%. Spot rates on the Caribbean-to-US East Coast (USEC) route increased 23% m-o-m to average WS167. Y-o-y, rates were also 23% higher.

Cross-Med spot freight rates showed further strong gains in March, increasing by around 39% m-o-m to average WS161. Y-o-y, rates were 30% higher. On the Mediterranean-to-NWE route, rates surged by 51% m-o-m to average WS146. Compared with the same month of the previous year, rates were 22% higher.
Clean tanker freight rates
Clean spot freight rates showed gains across all monitored routes. On average, rates increased 32% m-o-m in March and were up by 55% compared with the levels seen in the same month last year. Gains were driven by improvements in both East of Suez and West of Suez rates, which increased 73% and 16% m-o-m, respectively

Rates on the Middle East-to-East route surged by 89% m-o-m in March to average WS185. Y-o-y, rates increased 67%. Freight rates on the Singapore-to-East route gained 63% m-o-m averaging WS208 and were 42% higher compared with the same month last year. In the West of Suez market, rates on the Northwest Europe (NWE)-to-USEC route rose 20% m-o-m to average WS184 points. They were 32% higher y-o-y. Rates in the Cross-Med and Med-to-NWE saw gains of around 15% to average WS240 and WS248 points, respectively. Compared with the same month last year, rates were 70% higher Cross-Med and up 65% on the Med-to-NWE route.


