

The International Energy Agency (IEA) says the world must transition from fossil fuel to renewable power. Their declaration is endorsed by many global institutions, governments, environmentalists, policymakers, and the media. Such a transition means relying primarily on greater use of wind turbines, solar panels, and batteries for electric vehicles. It also means managing grids with increasingly unreliable sources of electricity generation, even as demand rises due to policies seeking to electrify everything else before 2050.
According to the IEA and others, building all that renewable hardware entails a massive fourfold to sixfold increase in the use of critical and rare earth minerals. That unprecedented increase in the volume of these minerals mined and refined will necessarily entail a collateral increase in the need to transport all those gigatons of materials, most of them by sea.
The global maritime industry already faces significant logistical, infrastructure, and manpower challenges to meet today’s needs for moving bulk goods. Advocates of an energy transition have failed to consider the shipping capacity required to transport the staggering rise in maritime ton-miles needed for the transition.
The transition-driven demand for more maritime ton-miles means there will need to be a monumental expansion of the world’s merchant vessel fleet. The data suggest that the world will need to nearly double shipyard capacity to build enough ships to carry the new tonnage by 2035 to support transition goals (and to replace older existing vessels). Today, the U.S. annually builds less than 1% of the world’s new vessel tonnage.
Nearly 80% of all the world’s goods in trade are already carried on ships. Ships are unavoidably critical for an energy transition because most mines supplying the necessary minerals are not in the United States, Europe, or even China for that matter; the majority of the refining of “energy minerals” takes place in China before transport to global buyers. If transition aspirations continue, the location of all the new mining and refining enterprises will determine just how much maritime traffic increases and how many more ships will be needed.
Setting aside which countries will or can build new vessels, shipowners now face additional uncertainty over how their vessels will be powered, given the International Maritime Organization’s mandates to decarbonize their fuel. The approved fuels will impact new ships’ costs and daily operating expenses, thereby inflating cargo costs.
U.S. policymakers need to examine this country’s existing maritime regulations, domestic and allied industrial capacities, and geopolitical exposures arising from the coming demand for minerals. It is also past time to explore the options for rebuilding domestic shipbuilding, infrastructure, and labor force capabilities not only because of commercial imperatives, but also because such capacities were, for example, critical to winning World War II. It is profoundly naïve to believe that shipbuilding capabilities are no longer required for global commerce or this country’s national security.
Introduction
The International Energy Agency (IEA) changed direction in conjunction with the 2015 Paris Agreement to advocate for an energy transition away from hydrocarbons—a view supported by other global organizations, many governments, environmentalists, policymakers, and the media.
For years, the IEA set out future world energy scenarios based on neutral, fact-based assumptions about the pace of economic growth, the development of societies, and the need for adequate energy for economies. Now the agency sees society shifting away from hydrocarbons— oil, natural gas, and coal—that supply over 80% of global energy.1
The energy transition relies on old, well-established technologies—wind turbines, solar panels, electric vehicles, and heat pumps for homes. While this collection of so-called “green” or “clean energy” technologies is well-established, its positives and negatives are also well-known. They form the backbone of transitionists’ “electrify everything” plan.
An important and underappreciated feature of these clean energy technologies is their huge requirement for minerals, including rare earth minerals, to fabricate their machinery. These minerals are expensive. As demand outstrips supply, rising mineral prices will drive up the cost of these alternative energy devices and systems. Global clean energy forecasts assume society will rapidly adopt these new technologies regardless of their cost. Moreover, the forecasts assume the volume of critical minerals needed for the alternative technologies will be readily available when needed.
A critical oversight in forecasts about, and plans for, the energy transition is not just in assumptions about the available supply of minerals, but also the logistical challenges of delivering to market the staggering increase in their volumes. These minerals must be hauled from where they are mined globally to where they will be refined and processed. The finished materials must then be transported to manufacturing sites to produce components. Finally, finished products must be shipped to markets around the world. Every step in this process requires transportation services.
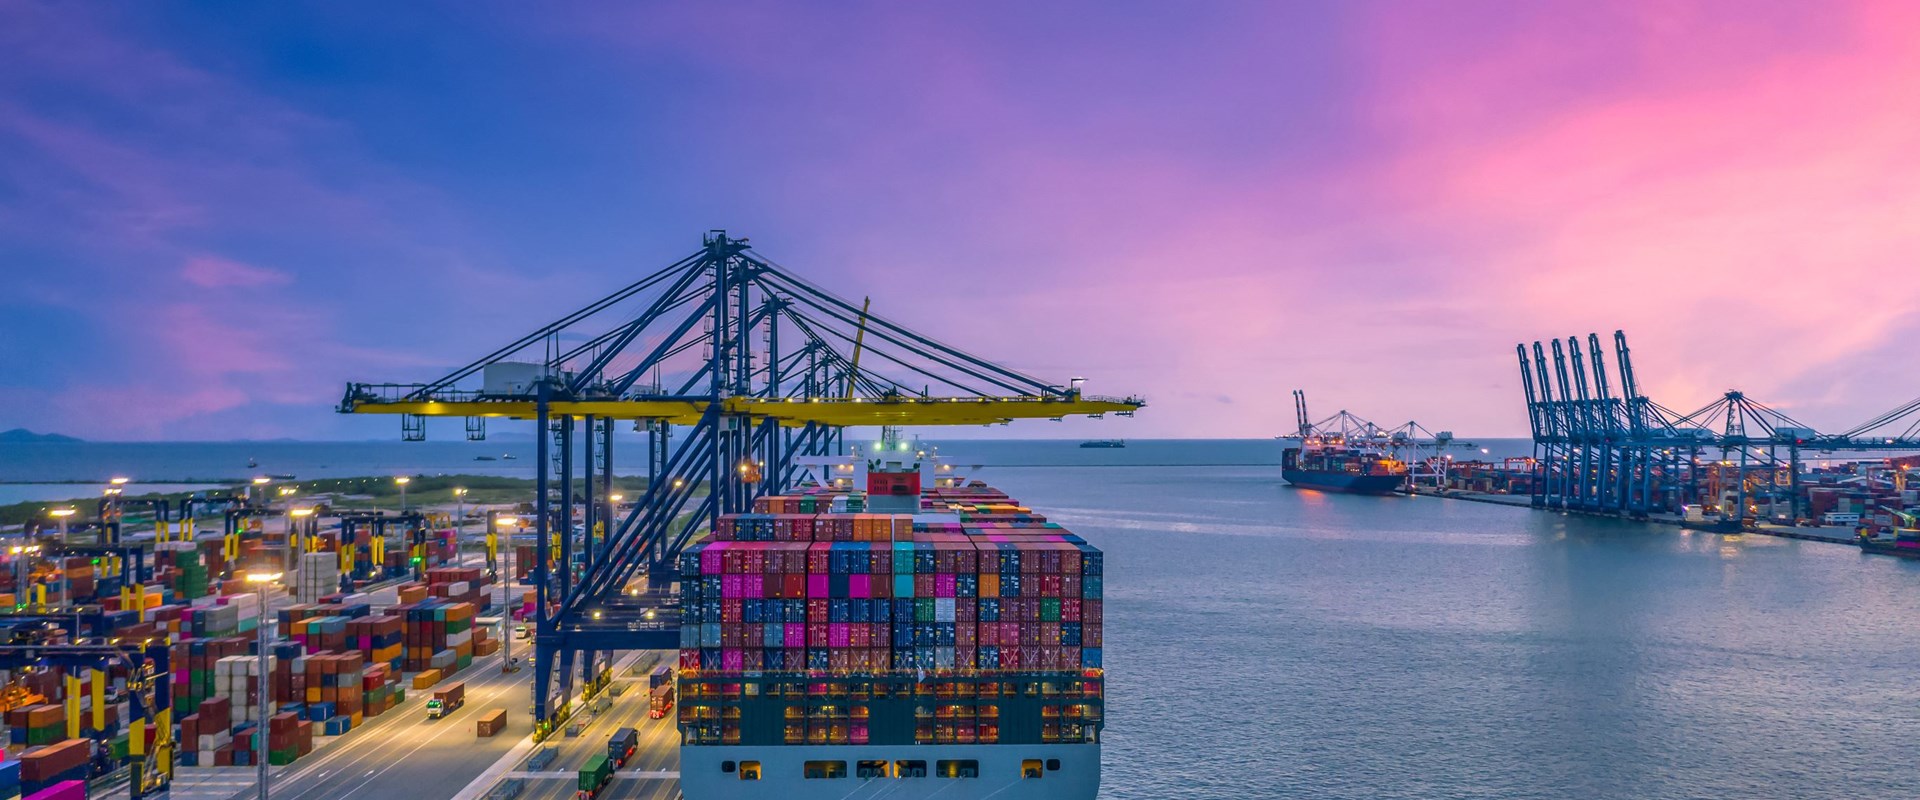
The global shipping industry has played a central role in this energy-materials supply chain throughout history. However, ships are seldom seen—visible only when loading and offloading cargoes—so few people, including energy forecasters and analysts, understand their role in the global supply chain.
Maritime transportation moves nearly 80% of the world’s goods and materials, making it a linchpin in the global economy.2 Economic disruptions occur when military or natural events force ships to deviate from their established trade routes, making voyages longer and adding to delivery times. Labor disputes at ports can often delay deliveries, too.
As global trade has increased in step with economic activity, so too has the growth of the maritime fleet. The strategic and economic role of this fleet should not be underestimated in the energy transition. This report provides insights into the black hole of maritime logistics as it pertains to ambitions for, and scenarios about, the energy transition.
Shipping’s Role in the Global Economy
A growing number of analysts have sought to estimate the magnitude of additional critical mineral volumes needed to meet ambitious energy transition scenarios. From agencies such as the IEA and World Bank to academic groups and think tank scholars from McKinsey,3 S&P Global,4 BloombergNEF,5 the Manhattan Institute,6 the Baker Institute,7 the Payne Institute,8 and the American Experiment,9 among others, have developed estimates of future mineral demand.
A comprehensive (1,000-page) analysis authored by Simon Michaux explored the range of primary mineral demands that arise from the /forecasts for transitioning the world’s current energy system to one run entirely on renewable energy.10 The well-documented data in Michaux’s report (as well as others that are similar) makes it clear that it is impossible to transition from a hydrocarbon-centered energy world to one dominated by renewable energy and battery storage. His report includes a very useful chart (see Figure 1) clearly illustrating the structure of the globe’s industrial ecosystems.
Figure 1: The Materials Cycle of Industry
Source: Simon P. Michaux, “Assessment of the Extra Capacity Required of Alternative Energy Electrical Power Systems to Completely Replace Fossil Fuels,” Geological Survey of Finland, Aug. 20, 2021.
What might be called “the black hole of the energy transition” occurs if the blue arrows in the Michaux chart disappear or, in the case of aspirational energy forecasters, are ignored. Surprisingly, few energy-transition analysts consider this linkage.
However, whenever a raw material or consumer product fails to arrive when promised or needed, people and businesses do notice and only then begin to look upstream at the shipping feature within the supply chain. There are myriad reasons for shipping delays or interruptions, not least, increasingly these days, the fact of, or potential for, military action, whether in the Red Sea or the Black Sea. Pirates off the African coast can disrupt the transit of goods. Even Mother Nature plays a role in tropical storms or droughts, such as the one that caused low water in the Panama Canal during most of 2023 and into early 2024, forcing ships to divert around the tip of South America, adding days and costs to vessel trips.
Oceans cover 71% of the planet, and the distances across them are vast. Most people crossing the oceans today make the journey by airplane in a matter of hours rather than traveling by ship, which takes days and weeks. Given the size of the oceans, ships spend most of their time away from shore. Shipping is thus the least visible part of our global transportation system. Yet it is also among the most important. The very large cargo vessels plying the world’s waters are hauling the materials, products, and consumer goods keeping the world’s economy functioning.
Traditionally, shipping’s value to the global economy is measured by the volume of goods and materials imported and exported from countries and regions. Thus, as noted earlier, 80% of world trade is transported by the global shipping industry. That volume represents 70% of the value of global trade.11
Historically, the World Bank has calculated trade’s value to the global economy by measuring the dollar value of all exports and imports divided by the global gross domestic product. That ratio rose from 38% in 1990 to 61% in 2008 at the start of the global financial crisis (GFC). Since then, the ratio has remained stagnant, leading to a popular perception that globalization has peaked and the world is deglobalizing trade.12
Sharat Ganapati and Woan Foong Wong, two economists who have studied the market, disagree.13 Instead of globalization peaking, they find more goods traveling greater distances than ever. They have recalculated the global trade measure using a ton-kilometer measure. In other words, they measure the weight of transported goods multiplied by the distance traveled. It treats moving five tons of material for 20 kilometers as equal to moving two tons for 50 kilometers or one ton for 100 kilometers.
The ton-kilometer index grew steadily from 1981 to 2020. By contrast, the World Bank’s trade value index showed steady growth until 2008, followed by a stagnant pattern until 2020. While Ganapati and Wong have yet to update their ton-kilometer metric, they have noted the difference in global shipping metrics between natural resources and manufactured goods and the impact of route lengths (see Figure 2).
Figure 2: Shipping Metrics: Natural Resources and Manufactured Products, 1965-2020
Transport Use by Weight and Distance
Transport Use by Value and Distance
Source: Sharat Ganapati and Woan Foong Wong, “How Far Goods Travel: Global Transport and Supply Chains from 1965–2020,” Journal of Economic Perspectives 37, no. 3 (Summer 2023), 3–30.
While the aggregate of agriculture, natural resources, and manufactured goods experienced dramatic growth from 1965 to 2020, measured by both weight and value by distance, there was a noticeable difference when the metrics were considered separately. The increase in transportation by weight and distance for raw materials is much greater than for manufactured goods. However, measured by value and distance, the low prices of agriculture and natural resources limit the index’s growth over the 55 years.
A driver of the performance differences is the longer distances materials and goods have traveled over the years. This reflects increased trade between countries farther apart. Between 2000 and 2024, the average sea voyage distance increased by 500 miles, 11% higher (see Figure 3).
Figure 3: Maritime Transport Distance Metrics, 1965-2020
Transport Use by Weight and Distance
Transport Use by Value and Distance
Source: Ganapati and Wong, “How Far Goods Travel.”
Within the transportation by weight calculations, according to Ganapati and Wong, short-distance Figure 3 countries only increased their volumes by 45% from 1965 to 2020. This contrasts with an 114% increase in trade for medium-distance countries and a 129% increase for long-distance countries. The transportation by value data told a very different story. All three distances experienced large increases: short-distance shipments increased by 211%, medium-distance trade increased by 134%, and long-distance shipments increased by 170%.
Heavier and lower-valued goods are traded between countries farther apart, while lighter and higher-valued goods move between countries located both near and far away.
To understand historical transportation market dynamics, one must first understand the history of maritime transportation, world trade, energy use, and economic growth. United Nations maritime transportation volume data and the World Bank’s global gross domestic product estimates show how trends evolved from 1970–2023. We can also assess the trends between liquid and dry cargo. Liquid cargoes include crude oil, petroleum products, and liquefied natural gas, while dry cargoes include all bulk materials and container shipments (see Figure 4).
Figure 4: Cargo Volumes and World GDP, 1970–2023
Source: UNCTAD, “World Seaborne Trade by Types of Cargo and By Group of Economies, Annual,” July 18, 2023; World Bank, Global Economic Monitor, author’s calculations.
The world economy grew steadily over 1970–2023, with a noticeable acceleration starting about 1996. This can be attributed to societies embracing technology—laptop computers, cell phones, and other personal devices—that improved productivity and economic growth. Dry cargo volumes closely tracked world GDP growth. Liquid petroleum volumes, however, grew more slowly over the entire 53-year span. Faster GDP growth with slow petroleum cargo growth suggests economies have become more efficient in using liquid energy to generate economic growth.
More detailed shipping cargo data from 1963–2018 shows the oil trade growing slowly as petroleum gases— liquefied natural gas (LNG) and liquefied petroleum gas—emerged as maritime cargoes beginning in the late 1980s (see Figure 5).
Figure 5: Maritime Cargo by Type, 1963–2019
Source: Martin Stopford, “Coronavirus, Climate Change & Smart Shipping: Three Maritime Scenarios 2020–2050,” Apr. 28, 2020.
Surprisingly, the data shows that coal cargoes have grown steadily since the early 1980s, despite Western economies turning away from using coal to generate electricity since the early 1990s. Reduced Western economies’ coal volumes have been redirected to China, India, other Southeast Asian countries, and South Africa. Although Figure 5 ends in 2018, the IEA has reported higher global coal consumption and shipments every year since. Furthermore, the IEA predicts coal consumption will increase through 2027.14
Two other commodities of note are iron ore and agricultural grains. Both have grown since the early 1980s, with iron ore’s increase particularly dramatic. Global population growth and rising living standards are driving their increase.
Global Shipping, Then and Now
Shipping has a 5,000-year documented history, yet only in the past two centuries have technological developments enabled it to contribute significantly to global economic growth. Wood and wind dominated seaborne trade until the 1840s. Both had problems— structural limitations on the size of wooden ships and intermittent winds extended travel times. The arrival of the steam engine revolutionized shipping, but it took over a century before sailing ships were replaced in global trade.
Initially, ships with iron or steel hulls and steam engines were similar in size to sailing ships, but their potential capabilities were significant. They became larger. They possessed the ability to sail on the tide, adhere to schedules, and maintain a consistent speed. Over the ensuing years, ship speeds increased from 5–7 knots (nautical miles per hour) to 23 knots by 1914 and upwards of 30 knots today. At the same time, fuel consumption per thousand ton-miles fell from 199 pounds of fuel in 1855 to 9.5 in the 2000s.15
These technological advances contributed to dramatic maritime trade growth. Between the 1840s and 2000s, the volume of seaborne cargo increased 400 times. In 2009, the eight billion tons of maritime trade equated to 1.2 tons of cargo for every person on the planet. For rich countries in Europe and North America, the imports are closer to three tons per capita.16
The world’s merchant fleet today comprises thousands of vessels of all shapes, sizes, and carrying capacities. The improvements in marine engineering enabled improvements in vessel speed, size, and operating expenses. The diesel engine and new shipbuilding techniques that emerged during World War II, for example, enabled the merchant fleet to create a wide range of ship types (see Figure 6). The emergence of specialized vessels in the postwar era increased the efficiency of handling specific cargoes.
Figure 6: Merchant Vessels: The Big Boys
Source: Shipping Intelligence, Marine Insight.
With growing maritime trade, the number of merchant vessels increased, as did vessel size. The United Nations Trade and Development (UNCTAD) organization tracks maritime trade and activity. From 2014 to 2024, the number of vessels in the global fleet and gross deadweight tonnage increased (see Figures 7 and 8). The merchant fleet grew by nearly a third, with vessel categories experiencing a wide range of increases ranging from near zero for general cargo ships to 65% for bulk carriers.
Figure 7: Global Merchant Fleet Vessels by Type, 2014 and 2024
Source: UNCTAD data, author’s calculations.
Figure 8: Average Vessel Tonnage by Vessel Type, 2014 and 2024
Source: UNCTAD data, author’s calculations.
With larger vessels entering the merchant fleet, the overall gross deadweight tonnage grew by 66%. The average tonnage of oil tankers, bulk cargo vessels, and container vessels increased from 2014 to 2024, while the general cargo and other ship categories remained static.
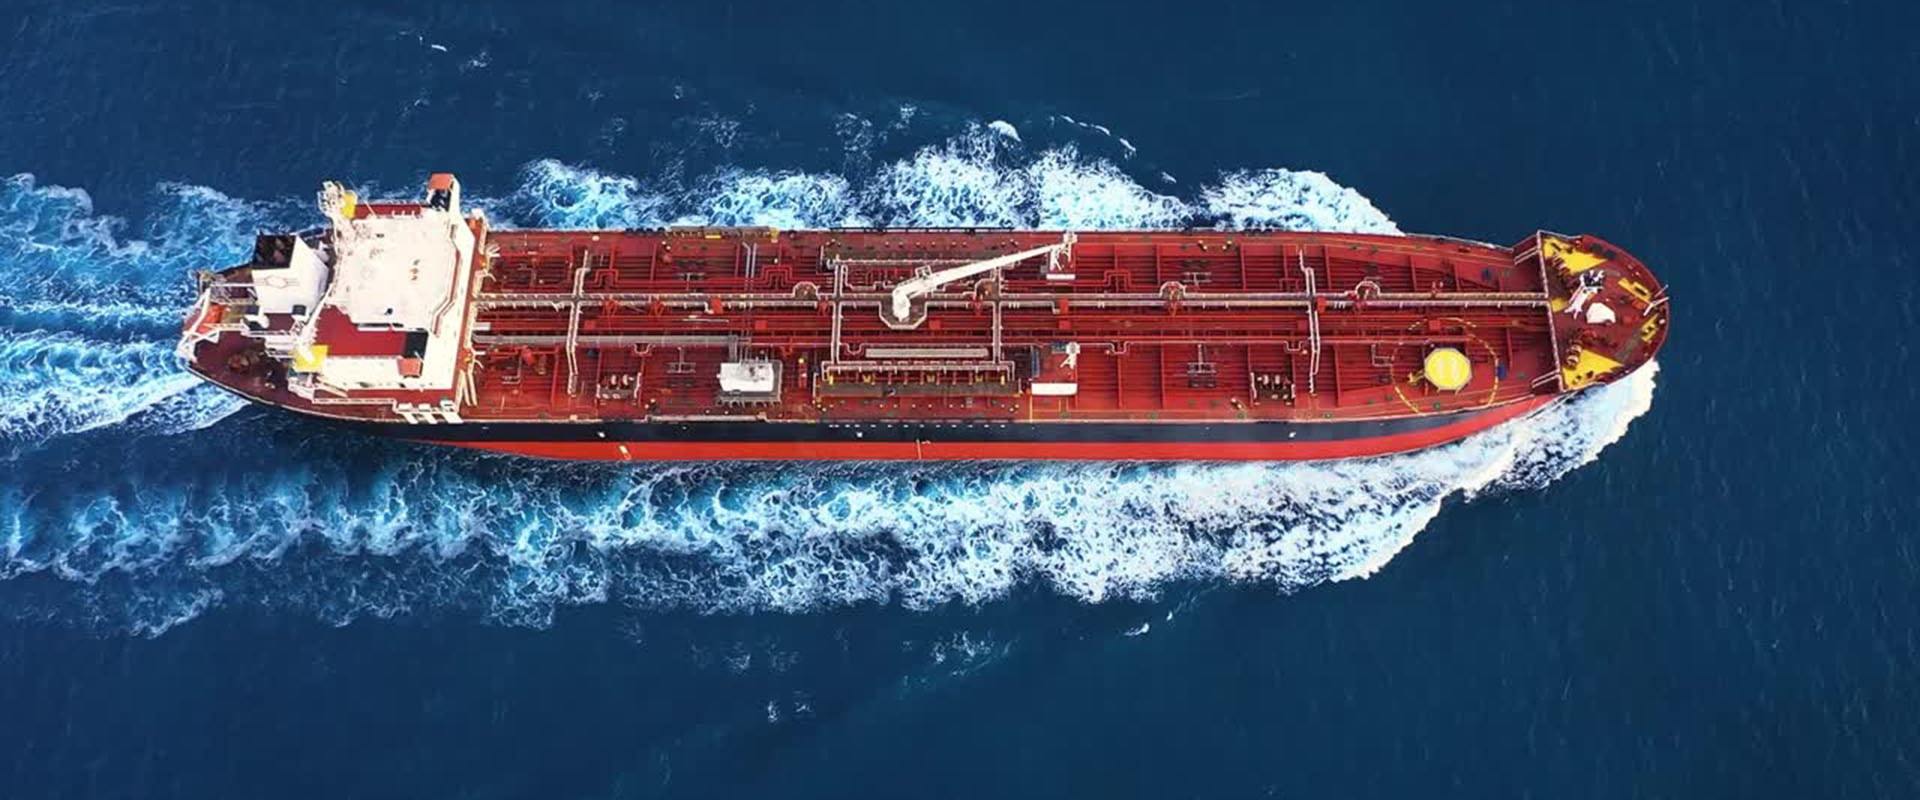
Cargo ships are expensive. They are built from steel and require months of welding and assembly, along with costly equipment to handle specific kinds of cargo, power the ship, and navigate the oceans. Costs vary over time and are affected by market conditions and the cost of materials and labor. This volatility occurred over the 46-year history of new-build prices for a Very Large Crude Carrier (VLCC), a key vessel for transporting oil around the world. The typical VLCC carries two million barrels of crude oil, roughly 2% of today’s 100 million barrels a day of global average oil consumption.
VLCC newbuild costs adjusted for shipyard costs experienced several dramatic cycles from 1976–2020. While reaching record low prices in 2020 during the pandemic, last year a VLCC was ordered at a cost of $129.5 million, back to 2010 levels.
A vessel’s initial construction cost establishes transportation rates. However, vessel daily and voyage rates fluctuate, reflecting current market conditions. These market dynamics also influence the /value of used vessels. The fluctuations often can be dramatic, reflecting surpluses or shortages of vessels in response to supply and demand dynamics (see Figure 9).
Figure 9: New VLCC Costs in Millions of U.S. Dollars
Source: , Sep. 9, 2020.
Every fleet category has experienced a history similar to VLCC shipbuilding costs. The cost of the components used in building ships tends to rise with global economic growth and inflation. However, vessel newbuild prices Figure 9 may fluctuate due to speculative construction orders or uneconomic vessel voyage rates. In other words, short term supply and demand dynamics.
For example, the cost of new bulk carriers rose sharply during the 2000s shipbuilding boom, as they benefitted from China’s explosive raw materials demand as it became the low-cost supplier of goods to the world. However, when the GFC ended that boom, bulk carrier newbuild prices never retreated to their mid-1990s levels as sustained demand elsewhere supported them.
The need for new vessels comes from maritime trade growth, which rises in line with global economic growth and the need to replace aging vessels. Most ships last about 25 years, although a small percentage may operate longer depending on their markets. The decision to extend operating lives depends on shipowners’ willingness to absorb higher maintenance and operating costs and the trend in vessel voyage rates.
The age makeup of vessel types also varies based on the number of ships built each year. Oil tankers, bulk carriers, and container fleets have less than 3% of their fleets older than 25 years. Older ships can become operational liabilities with potentially disastrous financial repercussions from accidents and vessel component failures. LNG tankers have nearly twice as many old ships in their fleet, which reflects the need to extend older ship operating lives to handle the surge in gas transportation needs.
As new gas carriers enter the fleet, older ship retirements will accelerate. As the global merchant fleet has expanded and been refreshed, the number of ships and the gross tonnage built each year has varied, shaped by the types of vessels in demand and shipowner willingness to commit to new ships. Costly capital-intensive investments are made only when the shipowner believes there is sufficient demand for the new build to produce earnings that will pay for the vessel, the cost of operating it, and generate a profit. The UNCTAD new vessel tonnage data reflects ships larger than 100 tons delivered each year from 2014 to 2023. That deadweight cutoff eliminates a large number of small vessels, often engaged in other maritime endeavors not related to global seaborne trade (see Figure 10).
Figure 10: Gross Tonnage of Newbuild Ships, 2014–2023
Source: UNCTAD data, author calculations.
UNCTAD also tells us where ships are built. In 2014, Asia built 97% of the capacity added. That remained true nine years later. In 2023, 93% of new vessel tonnage came Figure 10 from shipyards in China, Korea, and Japan. Europe built between 2.5%–3.0% of all new tonnage in those years. The Americas delivered one-tenth of 1% in 2023, down from seven-tenths of a percent of tonnage built in 2014. Interestingly, all shipbuilding in the Americas in 2023 occurred in North America, while South America accounted for half the Americas’ total in 2014 (see Figure 11).
Figure 11: Shipbuilding by Geographic Region and World
Source: UNCTAD data, author’s calculations.
Asia dominates the global shipbuilding business because it has cheaper materials, power, and labor, which is key to the economic success of China, Korea, and Japan. Those nations’ governments have embraced shipbuilding because it generates foreign currency while creating jobs and boosting demand for industrial output needed in construction.
This geographic imbalance in shipbuilding prowess is now a serious challenge for the global maritime industry, particularly for U.S. geopolitical security. U.S. policymakers should ask whether and how to sustain and expand a domestic shipbuilding industry and how to re-acquire the needed skills. This is a particularly critical issue given the role domestic ships and shipbuilding play in the U.S. Navy’s “sealift” capacity, i.e., military and nonmilitary ships that transport military equipment and supplies.
Commodities and Shipping Trade Routes
Trade and the physical movement of enormous quantities of goods have always been and will continue to be critical for the world’s economy to grow. Trade in agricultural commodities so people can eat. Trade in energy materials to power economies. Trade in the materials identified by scientist and policy analyst Vaclav Smil that form the four pillars of modern civilization— ammonia (the primary source of nitrogen for fertilizer production and thus crucial for the global food supply), steel, concrete, and plastics. Trade in the finished goods needed by societies for everyday life. Shipping is the backbone of this global trade.
Global trade volumes have increased threefold over the past four decades, from 3,704 to 10,985 million metric tons.17 Trade in fuels and materials for heavy industry accounts for nearly two-thirds of shipping cargoes. Hydrocarbon fuels alone represent 40% of the seaborne trade. Iron ore for steel and bauxite for aluminum account for 20% of the seaborne trade.18 These goods move long, medium, and short distances from where they are produced to where they are refined and consumed. Without ships, it would be impossible to transport these heavy cargoes such distances. That would restrict the world’s ability to capitalize on their value.
The IEA has documented the concentration of material movement along certain maritime trade routes.19 While the value of these trade routes is interesting, the volumes transported are of greater importance in understanding the evolution of the global shipping industry and its future in the energy transition being engineered by policymakers.
Dry bulk shipping volumes are concentrated along both North-South and East-West routes. The volumes being moved are relatively concentrated. The top five exporters—the United States, Australia, Brazil, China, and the European Union—each have roughly a 10% share of the trade in terms of value.
Europe and China are the main dry bulk import hubs. Australia, Brazil, and Indonesia are the leading dry bulk suppliers to China. Australia mostly supplies iron ore and coal. According to the IEA, a single trade route from three Western Australian ports to China represents over 700 million metric tons (Mt) of iron ore annually, accounting for 7% of global dry bulk shipping. Ports in Queensland, Australia, shipped 180 Mt of coal to Japan and Korea, representing 2% of dry bulk shipping.
Two ports in Brazil shipped 250 MMt (million metric tons) of iron ore in 2023, 2% of global shipping activity. Another important trade route is from the African nation of Guinea to China, which involves almost 100 Mt annually of bauxite for aluminum. Annually, around 20% of the global copper supply goes from Peru and Chile to China.
The concentration of liquid hydrocarbon production in the Middle East and the United States means that most of the seaborne trade moves along East-West routes. China has become a major liquid hydrocarbon importer and the largest recipient of Middle East crude oil output.
Liquid hydrocarbon trade is influenced by the quality of the oil produced which is matched with refinery configurations. How much heavy, sour crude oil they can process versus light, sweet crude oil they need impacts where the raw material is sourced and used, thus affecting trade routes.
A significant amount of liquid hydrocarbons is in the petrochemical trade. In most cases, that trade is similar to the refinery trade, but some localized petrochemical complexes create unique trade routes.
Container shipping is primarily an East-West flow. Measured in value, this East-West trade represents 40% of total container trade. The IEA notes that the United States, European Union, and China container trade accounts for roughly half of global combined imports and exports.20
Disruptions in trade routes, such as the divergence of ships transiting the Red Sea and Suez Canal because of military attacks, add time to vessel journeys and additional costs that inflate cargo prices. These costs impact intermediate and finished goods prices or are absorbed in the refiner, processor, and manufacturers’ operating margins.
Critical Minerals and the Energy Transition
The energy transition envisions shifting today’s system from high dependence on hydrocarbons—oil, natural gas, and coal—to renewables, primarily solar and wind, supported by battery storage and some low-carbon fuels. That will require using vehicles, appliances, and machinery that run on electricity. A change of this magnitude means that the world will be dependent on intermittent power sources and Mother Nature. However, in contrast to our existing electricity grids with instant power delivery, if the sun doesn’t shine /or the wind doesn’t blow, there is no electricity. Therefore, mineral-intensive batteries are needed for backup power.
The world has undergone energy transitions in the past, but not the kind contemplated by climate planners today. Past “transitions” occurred only in terms of the share of energy supplied by one form of energy or another. In absolute terms, the world has never experienced a decrease in the use of any significant source of energy: all are greater today compared to decades or centuries ago. We moved from primarily (again as a share of the total) biomass (wood) to coal, crude oil, and natural gas. These transitions required decades to occur. However, the dominant fuel replaced continued being a supplier for keeping the global economy operating.
The record of energy transitions over the centuries reflects the adoption of higher-energy-density fuels (i.e., fuels that store more energy in a given volume or mass) to displace lower-energy-density fuels (see Figure 12). However, the current energy transition demands that the world move in the opposite direction: from higher-density fuels to lower-energy-density fuels. This requires substantially more (renewable) energy-generating capacity, which in turn requires greater amounts of critical minerals and rare earth minerals.
Figure 12: Energy Transitions, Past and Present
Source:
While massive investments, government subsidies, and energy mandates drive the global energy transition, analysts are growing concerned about the supply of critical minerals, especially rare earth minerals required to meet the projected increase in electricity and electric-powered products. Studies are being undertaken to quantify the magnitude of raw materials that must be forthcoming to sustain the energy transition. These studies attempt to answer the question of whether there are sufficient mineral supplies in the earth’s mantle to meet the needs. They are also assessing resource locations and the difficulties in gaining access.
Some studies envision mineral recycling as a source of supply, easing fears of raw material shortages. Whether recycling works economically for these key minerals is unclear. The standard answer is that economies of scale will reduce the per-unit cost of recycling operations, making them attractive supply additions. Moving scrap metals is a small trade market now, but one that might grow.
Like every forecast, plan, and projection, the outcome depends on the assumptions. The key characteristic of these studies is their lack of long-term forecasts. The most notable long-term study came from the IEA. It identified minerals important for electric vehicles, onshore and offshore wind turbines, solar panels, nuclear plants, and coal and natural gas plants using carbon capture technology to minimize their emissions.21 The IEA identified key minerals, including copper, lithium, nickel, manganese, cobalt, graphite, chromium, molybdenum, zinc, rare earths, and silicon. Steel and aluminum, both important components of a functioning global economy, were excluded from consideration.
The IEA study was based on its two main / energy scenarios. “The Sustainable Development Scenario (SDS) charts a pathway that meets in full the world’s goals to tackle climate change in line with the Paris Agreement, improve air quality, and provide access to modern energy.” The Stated Policies Scenario (STEPS) “provides an indication of where today’s policy measures and plans might lead the energy sector.” The IEA believes these studies provide a range of possible outcomes.
More recently, the IEA has adopted new forecasting scenarios (see Figure 13). It retained its STEPS model, forecasting our likely energy future. It introduced the Announced Pledges Scenario (APS), which attempts to project what happens if all government energy and climate targets, including their net zero goals, are met fully and in a timely manner. Additionally, the IEA added the Net Zero Emissions by 2050 (NZE) Scenario. It is designed to highlight the narrow path to reaching net zero emissions by 2050 and limit global warming to 1.5 °C.
Figure 13: Energy Transition Minerals
Source: IEA, “The Role of Critical Minerals in Clean Energy Transitions,” March 2022, 9.
Figure 14: The Geographic Concentration of Critical Minerals
Source: IEA, “Global Critical Minerals Outlook 2024, May 2024, 100.
The range of increases between 2020 and 2040 for lithium, graphite, cobalt, and nickel is 19 to 42 times. For cobalt, the IEA says the demand increase can range between 6 to 30 times depending on assumptions about the evolution of battery chemistry and climate policies. It states that the electricity grid expansions mean copper demand for power lines more than doubles. Demand for every mineral will grow, with some experiencing dramatic increases in relatively short periods. Figure 13 Energy Transition Minerals After 2040, the IEA plans for demand growth to slow as it assumes that recycling and alternative chemistries for many clean energy technologies will reduce raw material needs.
The IEA pointed out that contrary to hydrocarbon energy, mineral mining is much more geographically concentrated. This concentration appears in commodity trade routes and the volumes moving between locations such as Australia and China or Latin American countries and China.
Currently, nickel, cobalt, natural graphite, and rare earth minerals show very high geographic concentrations (see Figure 14). Those concentrations are not projected to change over the next 15 years. Such concentrations increase the supply chain risk for key minerals. That risk, given the projected demand growth, has prompted mining companies to seek new mines. A problem the IEA has highlighted is that the timeline from initial mineral discovery to new mine shipments is 16 years on average. Therefore, meeting mineral demand in the 2040s requires discovering new mineral deposits now, with mine construction permitting starting soon.
The critical minerals industry also faces a refining concentration challenge. Outside of nickel, China accounts for over 50% of the world’s key minerals’ refining capacity. Moreover, the IEA predicts that China’s share of global mineral refining capacity will climb between 2023 and 2040 (see Figure 15).
Figure 15: Critical Minerals Refining: China Is in the Driver’s Seat
Source: IEA, “Global Critical Minerals Outlook 2024,” May 2024, 101.
If the mining industry decides to reduce its Chinese refining exposure, it must invest in new refining plants, adding to the estimated $800 billion mining investment the IEA says must be made between now and 2030 to keep the world on track for limiting carbon emissions.22 Adding new refineries will also likely result in new maritime shipping routes. Depending on where the new capacity is located, new vessel types may also be required.
Maritime Trade and Shipping to 2050
What are the implications for the maritime industry from a subsidized and forced energy transition? More importantly, what would it take for the maritime industry to handle the volume of minerals needed to be moved, and how costly will it be? Few forecasters address these questions when they urge on the clean energy transition. Rather, they assume the ships will be there when the mines begin producing and the new refineries start processing the ores into materials for clean energy products.
Lurking in the background of the maritime industry’s future is its decade-long efforts to reduce its carbon emissions. The latest move came in July 2023, when the International Maritime Organization adopted the 2023 IMO Greenhouse Gas Strategy, replacing and strengthening its 2018 Initial Strategy. The new strategy significantly strengthens shipping’s greenhouse gas (GHG) reduction targets.23 The strategy calls for reaching net-zero GHG emissions from international shipping by around 2050, with interim reduction checkpoints of 20% from 2008 emissions by 2030 and 70% by 2040.
The GHG policy follows the successful implementation of IMO 2020, which required all ships to burn fuel with a sulfur content of no more than 0.5% by weight unless it was fitted with an exhaust gas emissions cleaner. This policy has successfully reduced the maritime industry’s use of high-sulfur fuel oil. In 2019, the year before IMO 2020, heavy-fuel oil provided 81% of the maritime industry’s fuel. For 2022, the latest available data shows the share down to 55%.24
As we consider the impact of growing demand for critical minerals and the implications for the international shipping industry, we remain mindful of the uncertainty ship owners face in their decisions about powering new buildings and existing young ships they wish to continue operating. The lack of clarity on future powering requirements, including their technical performance, cost of operation, and availability of fuels, is slowing orders for new builds needed to handle the increased cargoes of the next 25 years or more.
UNCTAD reports that maritime trade in 2023 reached 12,292 million metric tons, up 2.4% from 2022 after falling from 2021 (see Figure 16). Maritime trade was projected to grow by 2.0% in 2024, with container trade up 2.7%. Trade ton-miles in 2023 reached 62,037 billion, a 4.2% increase driven by longer voyages due to the war in Ukraine and the Red Sea, and low water in the Panama Canal. Distance-adjusted trade volumes outpaced cargo growth in tons in 2022 and 2023. They likely outperformed last year, too. The average voyage distance began increasing in 2005. In 2000, it was 4,675 miles, which increased to 5,186 miles in 2024.
Figure 16: Seaborne Trade Growth, 2000–2024
Source: UNCTAD, “2024 Review of Maritime Transport 2024,” October 2024, 2.
Global maritime trade growth is projected to average 2.4% from 2025 to 2029, with container growth averaging 2.7% annually. The challenge is forecasting maritime trade growth to 2050 while incorporating the projections for critical mineral volumes due to the planned energy transition.
Trade is closely linked with economic growth. The Organization for Economic Co-operation and Development (OECD) is projecting annual real GDP growth to 2050 for this large group of countries averaging 1.85%.25 That suggests nominal GDP growth may average around 3% annually over the period. That is consistent with the average annual growth of global GDP, measured in current dollars, of 3.14% for 1970–2023.26
The IEA’s latest STEPS, APS, and NZE projections assume global GDP growth averages 3.1% for 2023–2030. However, it projects only a 2.7% compound annual growth rate for 2023–2050, suggesting a significant slowing in GDP growth after 2030.
Another economic outlook underlying a shipping demand forecast projects a doubling of GDP between now and 2050, consistent with the IEA’s forecast. This economic growth translates into a 40% increase in maritime trade in ton-miles across all ship categories (see Figure 17).
Figure 17: Seaborne Trade Growth in Ton-Miles by Vessel Type, 2000–2024
Source: , Energy Transition Outlook 2024, October 2024, 24. (/yr is Gross tonnage per nautical miles per year.)
A shipping consultant, Adam Kent, Managing Director of Maritime Strategies, noted that shippers like tons as much as miles. He pointed to tons in the oil tanker market increasing around 2% in 2024 while the increase in miles traveled due to the Red Sea and Ukraine issues has ton-miles up 5%–6%. Kent expects coal volumes going into Europe to decline for the next several years. However, coal exporters such as Columbia and South Africa that fed their exports into that market are now shipping volumes to Asia, so ton-miles are rising.
New trade routes will change the shipping industry dynamics as more short-duration voyages are developing for small bulk carriers. These voyages negatively impact ton-miles. However, longer trips for cargoes such as coal are offsetting that short-duration affect on ton-miles.
At the same time, several clean energy commodities are projected to grow dramatically, although some seem to be developing more slowly than anticipated. Niche fuel markets such as ammonia and methanol are projected to be key to the maritime industry’s decarbonization plan. (These fuels are to be created through the Figure 18 use of surplus renewable energy making them “green” fuels.) No ammonia or methanol volumes are being transported today. By 2030, 15 million tons of clean ammonia and 15 million tons of clean methanol are expected to be shipped. In 2050, 200 million tons of clean ammonia and 100 million tons of clean methanol are projected to be shipped annually. A new fleet of tankers will be needed to enable the global methanol and ammonia trades to develop.
In 2020, Clarksons Research forecasted maritime trade growth for 2020–2050, incorporating the pandemic and the expected impacts of technological changes and climate change on the industry.27 Our history enables us to judge which trendline maritime trade is actually following, which also allows us to assess shipbuilding needs.
Recent maritime trade data and UNCTAD forecasts suggest the industry is on a growth trend somewhere between Clarksons’ Sea Trade Scenarios 1 and 2 (see Figure 18). This means global maritime trade—in terms of the millions of metric tons of cargo ships—will need to grow between 2.2% and 3.2% annually.
Figure 18: Ship Building Necessary for an Energy Transition, Including Replacing Older Vessels
Source: Martin Stopford, “Coronavirus, Climate Change & Smart Shipping: Three Maritime Scenarios 20202050,” Apr. 28, 2020.
Turning to shipbuilding, Clarksons Research’s forecast suggests that around 2035, the annual tonnage of new ships delivered to meet its Sea Trade Scenario 1 must be 50% greater than the industry’s 2011 all-time peak in deliveries (See Figure 18). Sea Scenario 2’s peak deliveries are 30% greater. Notable is that the 2010–2015 delivery peak was nearly three times the capacity delivered in the 1970s, a boom driven by the 1973 Oil Embargo and the restructuring of the global oil industry. The most recent delivery peak was in response to the container shipping boom after the GFC and China’s role as the world’s manufacturer of choice was established.
The forecasted post-2020 collapse did not happen. UNCTAD reported that after falling 12% in 2020, deliveries in 2021 rose by 5%. However, deliveries declined by 8% the following year before rebounding by 16% in 2023, putting gross tonnage delivered only 2% below 2019’s deliveries.
With the great uncertainty about how maritime vessels will be powered under the IMO decarbonization strategy, shipbuilding activity remains constrained. No shipowner wishes to build a ship powered by equipment that might be restricted or banned in the future. The cost to repower ships is not cheap. Therefore, it is better to err on the side of caution when ordering vessels. That means extending the operating lives of middle-aged vessels even if their maintenance and operating costs are higher than new ships. This avoids making bad capital investment decisions. However, such a strategy delays the time when ships will be replaced. It leads to a pattern of constrained shipbuilding activity exploding when ship-powering options become clear.
The significant decline in shipbuilding following the 2010–2015 delivery boom drove shipyards out of business. In 2022 there were only 131 “large” active shipyards, down more than half from the 320 operating in 2009. Active shipyard capacity is down 40% over the past decade.28
A further contraction in the number of large shipyards occurred last year, bringing the shipbuilding industry’s capacity down by 35% from its 2011 peak.29 As a result, the delivery time for new build orders had stretched to 3.5 years from 2.5 years in 2020. For the shipbuilding industry to deliver the magnitude of new ships needed in 2035, it must expand significantly—potentially increasing capacity by 60%–90% above today.
Shipping’s Future in the Predicted Energy Transition
The energy transition envisioned will require a dramatic increase in renewable energy. It will require substantial new generation from equipment dependent on components made from critical and rare earth minerals. Consultant McKinsey has conducted studies of the physical challenges for the energy transition. Under its 2023 Achieved Commitments scenario, demand for seven of eight critical minerals investigated could at least double by 2030. Those minerals included lithium, cobalt, nickel, dysprosium, terbium, neodymium, praseodymium, and copper. Demand ranges from 1.5 times for copper to seven times for lithium.30
The growth in critical mineral demand is driven by the low density of renewable energy that necessitates overbuilding capacity to match the output from the smaller generation capacity needed by hydrocarbon energy. The new mines and refineries will create new maritime trade routes and require more ships to move the huge ore volumes to be mined and refined to meet the projected demand increase.
The IEA’s “Net Zero Emissions by 2050 Scenario (NZE)” says the increased shipping necessary for critical minerals can be met because there will be little need for hydrocarbon energy transportation. Therefore, there will be no need to build ships for hydrocarbon energy. Yet this assumption stands in contrast to the scenario’s call for 10% of global energy coming from hydrocarbons at its end point.31 Moreover, the IEA’s STEPS and APS scenarios call for even more hydrocarbon energy by 2050, 58% and 25%, respectively.32
Furthermore, the IEA’s view of economic growth to 2050 assumes it will not cause maritime trade to grow despite the reality that grains, iron ore, bauxite, copper, nickel, and other minerals will be needed in greater amounts as the world population expands by a billion or more people. The IEA’s assumption for no shipping growth requires breaking the historical /maritime trade link that has existed for centuries.
The maritime industry will need a larger fleet to transport additional mineral volumes for clean energy technologies. Furthermore, it must renew the existing f leet, as ships typically operate for only 25 years.
A realistic assessment suggests the global shipbuilding industry must be capable of delivering 30%–40% more tonnage than at its 2011 peak. However, since that peak, global shipbuilding capacity has declined materially as the number of active large shipyards fell from 320 to 131 in 2022 and further declined in 2023.
The magnitude of the shipyard capacity decline means the industry faces a huge deficit in meeting the maritime industry’s future needs. A 30%–40% capacity decline in the past decade, coupled with the need for 30%–50% more capacity than at the last peak, means the shipbuilding industry will have to add capacity to build 60%–90% more deadweight tonnage than it can currently. Vessel prices will need to rise to incentivize the shipbuilding industry and provide the capital for new shipyards. More expensive ships will increase the cost of maritime trade for all cargoes.
Moreover, the question of where these new ships will be built remains. Shipbuilders in China, Korea, and Japan today construct roughly 95% of the world’s new vessels. American shipyards delivering less than 1% of the world’s new tonnage poses a dilemma for the United States. Does the U.S. want to rely on foreign shipowners and shipbuilders to ensure sufficient vessels to move the goods and raw materials the nation needs, increasing economic and geopolitical uncertainty and possibly putting national security at risk?
Conclusions
The world faces a challenge if it continues on the forced transition path away from a global economy powered primarily by hydrocarbons to one relying entirely on renewable energy. The world’s energy system will become dependent on old technologies–wind turbines, solar panels, electric vehicles, and heat pumps for homes–that now are praised for being “green” or “clean.”
We know a lot about these old technologies. They require huge amounts of critical and rare earth minerals. Those huge mineral volumes will need to be transported around the world. The merchant fleet will have to add more vessels, and these vessels will have to travel more miles. And yet, the global shipbuilding industry does not appear poised to expand sufficiently to meet the maritime industry’s new tonnage needs. Moreover, where will these ships be built? By lacking a meaningful domestic shipbuilding industry, the U.S. will increasingly be at risk of geopolitical disruptions with potentially significant economic ramifications.
Recreating the U.S. shipbuilding powerhouse of World War II will be a challenge. It will require re-examining our maritime legal structure—the Jones Act, which requires that merchandise transported by water within the U.S. be carried on ships that are owned, built, and crewed by U.S. citizens. That means constructing new shipyards and training many more shipyard workers. This would aid our nation’s defense efforts in the pursuit of building new U.S. Navy ships. Still, alliances with neighboring countries or investing in countries that need job-creating industries should be explored as well.
Endnotes
| 1 | IEA, “World Energy Outlook 2024,” Oct. 16, 2024. |
| 2 | UN Trade and Development (UNCTAD), Review of Maritime Transport 2024, October 2024. |
| 3 | McKinsey Global Institute, “The Hard Stuff: Navigating the Physical Realities of the Energy Transition,” Aug. 14, 2024. |
| 4 | Daniel Yergin, “The Future of Copper: Will the Looming Supply Gap Short-Circuit the Energy Transition?” S&P Global, July 2022. |
| 5 | BloombergNEF, “New Energy Outlook 2024,” May 21, 2024. |
| 6 | Mark P. Mills, “Mines, Minerals, and ‘Green’ Energy: A Reality Check,” Manhattan Institute, July 9, 2020. |
| 7 | Michelle Michot Foss, “Minerals and Materials Challenges for Our Energy Future(s): Dateline 2024,” Baker Institute for Public Policy, Sep. 20, 2024. |
| 8 | Morgan Bazilian, “The State of Critical Minerals Report 2024,” Colorado School of Mines, Payne Institute for Public Policy, Oct. 11, 2024. |
| 9 | Debra Struhsacker and Sarah Montalbano, “Mission Impossible: ‘Net-Zero’ is a Non-Starter Without More Minerals and Better Permitting,” Center of the American Experiment, October 2024. |
| 10 | Simon P. Michaux, “Assessment of the Extra Capacity Required of Alternative Energy Electrical Power Systems to Completely Replace Fossil Fuels,” Geological Survey of Finland, Aug. 20, 2021. Michaux is a Research Professor at the Geological Survey of Finland. |
| 11 | Myrto Kalouptsidi, “The Role of Shipping in World Trade,” , June 9, 2021. |
| 12 | World Bank Group, DataBank, 2023. |
| 13 | Sharat Ganapati and Woan Foong Wong, “How Far Goods Travel: Global Transport and Supply Chains from 1965–2020,” Journal of Economic Perspectives 37, no. 3 (Summer 2023), 3–30. |
| 14 | William Mathis, “Coal Demand to Keep Hitting Records Through 2027, IEA Says,” Bloomberg News, Dec. 18, 2024. |
| 15 | Martin Stopford, “How Shipping Has Changed the World & the Social Impact of Shipping,” Global Maritime Environmental Congress, Sep.7, 2010, 4. |
| 16 | Stopford, “How Shipping Has Changed the World,” 2. |
| 17 | UNCTAD data and author’s calculations. |
| 18 | IEA, “Energy Technology Perspectives 2024,” October 2024. |
| 19 | Ibid. |
| 20 | Ibid. |
| 21 | IEA, “The Role of Critical Minerals in Clean Energy Transitions,” March 2022. |
| 22 | IEA, “Global Critical Minerals Outlook 2024,” 9. |
| 23 | International Maritime Organization (IMO), “2023 IMO Strategy on Reduction of GHG Emissions from Ships,” July 2023. |
| 24 | International Maritime Organization, “Fuel Consumption and Carbon Intensity.” |
| 25 | OECD, Real GDP Forecast. |
| 26 | World Bank, World Development Indicators, Oct 24, 2024, author’s calculations. |
| 27 | Martin Stopford, “Coronavirus, Climate Change & Smart Shipping: Three Maritime Scenarios, 2020–2050,” Apr. 28, 2020. |
| 28 | Stephen Gordon, “2022: Shipbuilding Review,” Clarksons Research, Jan. 12, 2023. Shipmanagement , Jan. 16, 2024. |
| 29 | “Clarksons’ 2023 Shipbuilding Review: Shipyard Output Up 10%, China Delivering Half of All Newbuilds,” , Jan 16, 2024. |
| 30 | McKinsey Global Institute, “The Hard Stuff: Navigating the Physical Realities of the Energy Transition.” |
| 31 | IEA, Net Zero Emissions by 2050 Scenario (NZE). |
| 32 | IEA, “World Energy Outlook 2024,” October 2024. |

