

Ghana
Tema: The 7-day average vessel waiting time is around 5.83 days. Average vessel waiting times remain elevated, with berth constraints, crane outages and yard congestion continuing to impact vessel schedules. To address these challenges and enhance terminal capacity, additional RTGs and ship-to-shore cranes are being deployed in Ghana.
Ivory Coast
Abidjan: The 7-day average vessel waiting time is around 8.56 days. Average vessel dwell times in June ranged from 4–7 days. High yard utilisation, road congestion and recent power outages continue to impact terminal operations and cause berthing delays. Some carriers have introduced Port Congestion Surcharges in response to these challenges.
Kenya
Mombasa: The 7-day average vessel waiting time is around 5.33 days. Persistent congestion, vessel queues and high yard utilisation continue to impact this key East African gateway. Equipment imbalances, customs delays, flood-damaged roads and truck shortages are restricting throughput and inland cargo movements.
Mauritius
Port Louis: The 7-day average vessel waiting time is around 2.0 days. Crane No. 100 remains under repair, potentially impacting berth productivity during peak periods. High traffic volumes may lead to occasional delays.
Nigeria
Apapa: The 7-day average vessel waiting time is around 1 day. Road and gate congestion are affecting operations and cargo evacuation. Inland constraints are prolonging cargo dwell times and driving up costs, with delayed import cargo evacuation increasing storage and demurrage risks.
South Africa
Coega: The 7-day average vessel waiting time is around 3.5 days. Carriers continue to report operational challenges at Coega, resulting in port omissions and amendments to vessel rotations. Seasonal tidal constraints, combined with backlogs stemming from recent adverse weather conditions, are contributing to ongoing operational disruptions.
Durban: The 7-day average vessel waiting time is around 2.0 days. Terminal operations remain operational but congested, with high reefer plug utilisation driven by peak citrus export volumes. Landside congestion and inconsistent truck turnaround times continue to impact efficiency, while operational pressure is expected to persist throughout the peak citrus season. However, Durban is currently experiencing heightened tensions and sporadic disruptions linked to anti-immigration protests. Despite the situation, operations at SACO and Zacpak continue as normal at this time.
Tanzania
Dar Es Salaam: The 7-day average vessel waiting time is around 3.5 days. Moderate congestion persists as cargo volumes increase following cargo diversions from Mombasa, placing additional pressure on port operations.
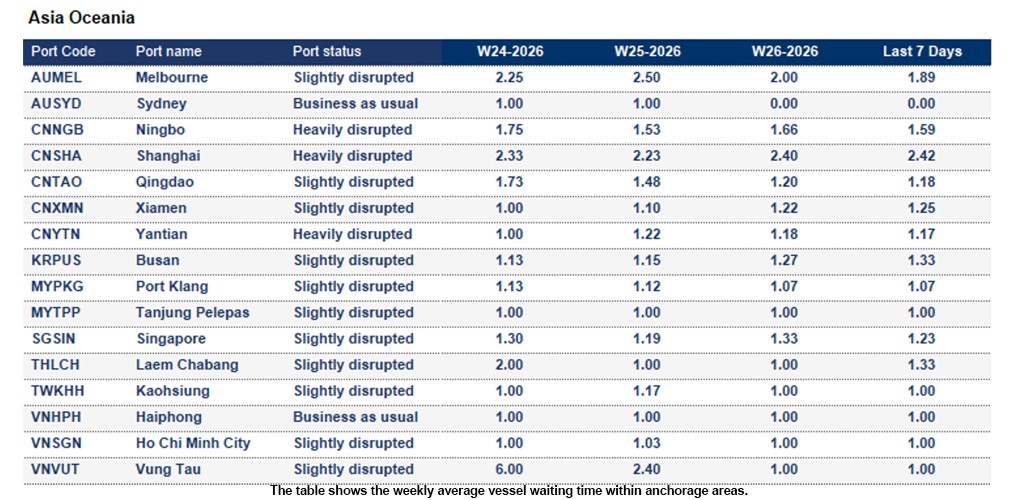
China
Ningbo: The 7-day average vessel waiting time is around 1.59 days. Waiting times have increased to 1.5–2 days as high yard density is impacting productivity, resulting in longer vessel port stays and concentrated arrivals.
Shanghai: The 7-day average vessel waiting time is around 2.42 days.
Waiting times at WGQ2 and WGQ5 remained at approximately two days throughout the week, driven by concentrated mainline vessel arrivals. At YGS12, average waiting times reached 4.5 days, primarily due to concentrated mainline arrivals and longer port stays resulting from increased operational volumes.
Xiamen: The 7-day average vessel waiting time is around 1.25 days. Two new gantry cranes are being installed to replace existing units at XHCT berths 15–16, with works expected to continue until mid-June. The ongoing equipment upgrade is contributing to congestion at XHCT, as operational capacity remains temporarily constrained during the installation period.
Yantian: The 7-day average vessel waiting time is around 1.17 days. Minor berth congestion persists at YICT, with vessel waiting times and delays of approximately 0.5–1 day. In addition, Berth 9 has remained non-operational since 20 May due to quay crane heightening works and is expected to remain idle until mid-September, reducing berth availability and operational flexibility.
Indonesia
Belawan, Sumatra: The 7-day average vessel waiting time is around 2.2 days. Berth congestion persists, with off-window vessels experiencing waiting times and delays of approximately 1–1.5 days. Operational productivity remains impacted by ongoing RTG issues, resulting in slower cargo handling performance.
Surabaya: The 7-day average vessel waiting time is around 1.19 days. Exceptionally high yard occupancy has resulted in significant terminal congestion, reducing operational capacity and disrupting gate pass processing. The terminal is implementing measures to accelerate yard clearance and restore normal operations. Extended operating hours have been introduced to support congestion relief and improve cargo flow. The 200m quay is still closed for the commissioning of new QC equipment, which is impacting berth availability & flexibility.
Japan
Yokohama: The 7-day average vessel waiting time is around 1.5 days. Berth congestion continues, with vessel waiting times of approximately 1–1.5 days, primarily driven by the bunching of incoming vessel arrivals.
Malaysia
Port Klang: The 7-day average vessel waiting time is around 1.07 days. At WSP, conditions remained stable during Week 26, with healthy yard density levels of 75–80%, strong productivity and minimal vessel waiting times. However, the situation may deteriorate in Week 28 due to anticipated high call volumes, increased container moves and vessel bunching, which could place additional pressure on terminal operations.
Philippines
Manila: The 7-day average vessel waiting time is around 4.33 days. Heavy berth congestion persists at Manila North, with off-window vessels experiencing waiting times and delays of more than five days.
Singapore
Singapore: The 7-day average vessel waiting time is around 1.23 days. PSA terminals remain busy, with vessel waiting times generally exceeding one day across all carriers as berth demand continues to outpace available capacity.
South Korea
Busan: The 7-day average vessel waiting time is around 1.33 days. At BNCT, laden yard density is approximately 82%. Overall, terminal conditions remained stable throughout Week 26, with no significant congestion reported.
Taiwan Area ,China
Kaohsiung: The 7-day average vessel waiting time is around 1 day. Capacity remains tight due to strong demand and overbookings.
Booking challenges continue, and capacity availability is currently assessed as high risk.
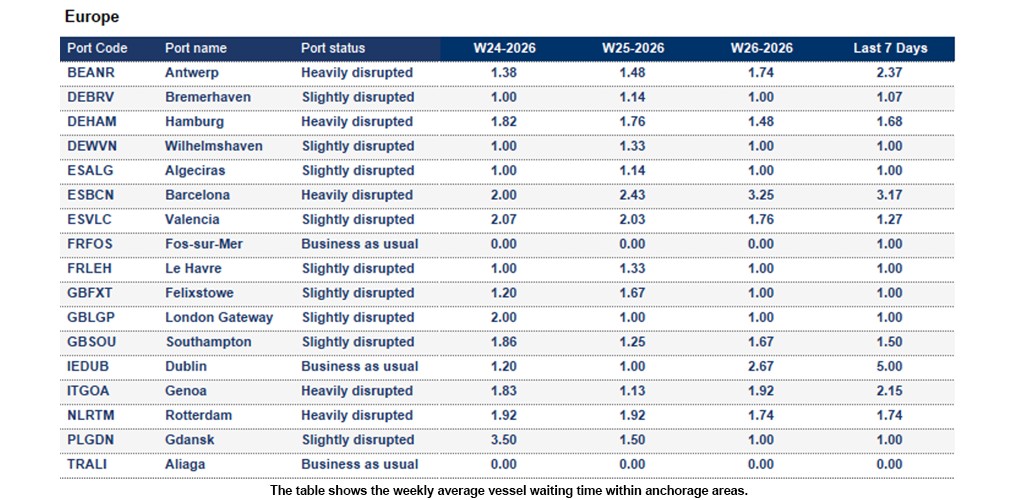
Belgium
Antwerp: The 7-day average vessel waiting time is around 2.37 days. Delayed vessel arrivals and inland constraints continue to impact operations. High barge waiting times, vessel bunching and increasing container dwell times are placing pressure on yard density, while carrier schedule reliability remains inconsistent.
Germany
Bremerhaven: The 7-day average vessel waiting time is around 1.07 days. Yard occupancy is approaching 90% and becoming increasingly tight, particularly for IMO and OOG cargo. While vessel schedules remain stable and operations are currently running to plan, the upcoming holiday period is expected to place additional pressure on resources and may lead to operational disruptions.
Hamburg: The 7-day average vessel waiting time is around 1.68 days. Yard occupancy is 85% with IMO reefer restrictions. Terminal remains congested, with delays for non‑Gemini vessels. Crane issues cut Berth 1–2 availability from 5 to 3; labour shortages expected this weekend. Terminal operates above capacity; further /29 restrictions likely. CTH at 85%, IMO 9 discharge constrained; fast import pick‑up needed. Operational limitations expected at HHLA terminals on 30 June due to staff assemblies.
Wilhelmshaven: The 7-day average vessel waiting time is around 1 day. Yard density remains manageable at around 80%; however, overall operations remain tightly constrained due to limited labour availability, with further pressure expected as the holiday season approaches. With no buffer in the vessel lineup, any disruption to schedules, equipment or staffing is likely to cause immediate delays. Vessel departures from CTA continue to impact the CTW vessel lineup.
Italy
Genoa: The 7-day average vessel waiting time is around 2.15 days. PSA Genova Prà faces escalating congestion alongside ongoing rail disruption. High yard utilisation, vessel bunching, labour shortages and union-related tensions are placing significant pressure on operations, with yard saturation and container rollovers of up to 2–3 weeks possible. Rail reliability remains poor due to infrastructure works, strikes and staff shortages, resulting in train cancellations, import backlogs exceeding one week and further delays across import and export flows. Read more here
Netherlands
Rotterdam: The 7-day average vessel waiting time is around 1.74 days. Rotterdam terminals have resumed normal operations following last week’s temporary closures. However, delays persist, particularly in truck operations, where the availability of booking slots remains limited. At ECT Delta, truck handling has been suspended again due to excessive truck arrivals, with vehicles being diverted to overflow parking areas.
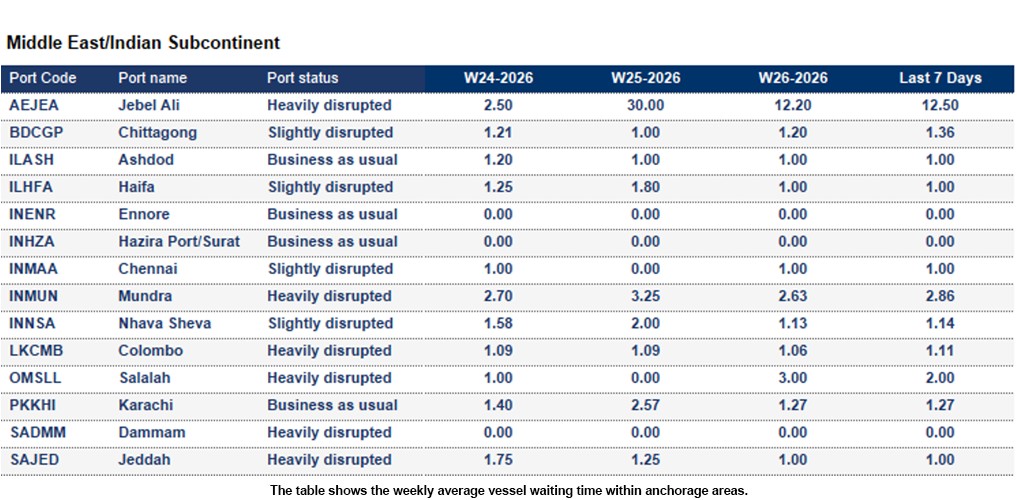
Middle East:
The IMO has temporarily suspended its vessel evacuation framework in the Strait of Hormuz following a projectile strike on the containership Ever Lovely. The incident has renewed security concerns in the region and increased uncertainty for vessels transiting the Middle East Gulf.
Shipping lines may face heightened operational risks, potential route restrictions and further delays as authorities reassess safety measures and transit arrangements in the strait. Read more here
India
Mundra: The 7-day average vessel waiting time is around 2.86 days. Rising cargo volumes, vessel bunching and inland transport constraints are impacting throughput. Acceptance of unscheduled and ad hoc vessel calls remains restricted to help manage yard density.
Nhava Sheva: The 7-day average vessel waiting time is around 1.14 days. Strong vessel activity continues, but congestion and inland bottlenecks are impacting efficiency. High yard utilisation, truck shortages and restricted gate operations are placing pressure on terminal productivity and cargo flows.
Sri Lanka
Colombo: The 7-day average vessel waiting time is around 2.14 days. High congestion continues due to Middle East cargo diversions. High yard utilisation and inter-terminal delays are affecting productivity, prompting some carriers to adjust terminal allocations to manage capacity constraints.
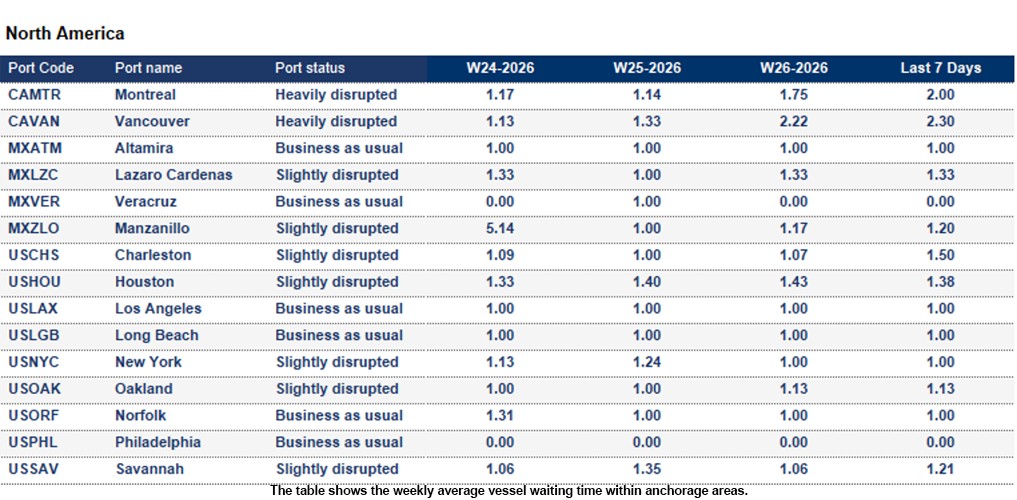
Canada
Average import rail dwell time for Canadian cargo (Vessel arrival to departure rail ramp):
Mexico
Manzanillo: The 7-day average vessel waiting time is around 1.2 days. Growing cargo volumes continue to place pressure on port and inland logistics infrastructure, impacting overall supply chain efficiency.
United States
Average import rail dwell and transit time for US cargo (Vessel arrival to departure rail ramp):
Brazil
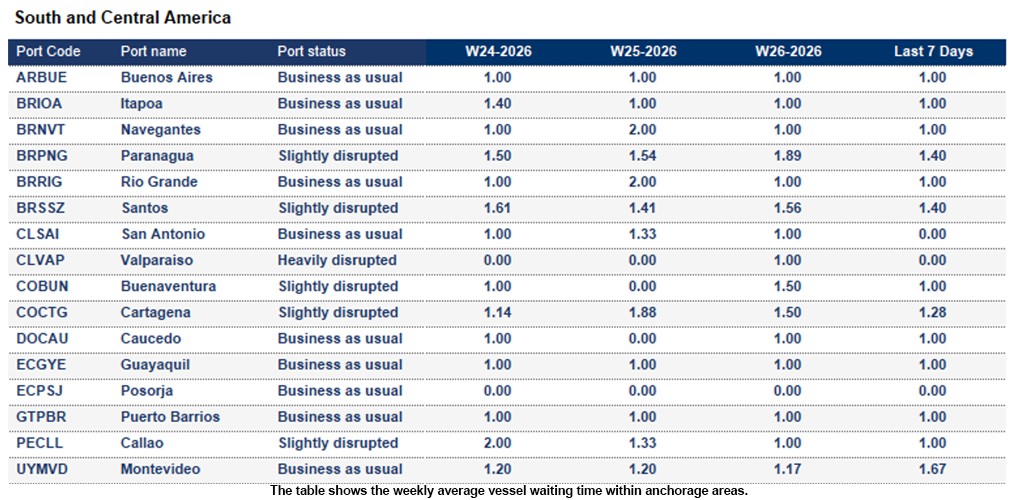
Paranagua: The 7-day average vessel waiting time is around 1.4 days. Infrastructure works, including recent dredging activities, continue to impact port operations, affecting vessel line-ups and berth allocations.
Santos: The 7-day average vessel waiting time is around 1.4 days. Mid-voyage carrier service changes have resulted in some vessels bypassing South Africa, with SA-bound cargo being transhipped via alternative hubs. Customers should liaise with their local branch for updates. Despite high yard density, port operations remain normal.
Chile:
Heavy swell conditions are restricting operations at the ports of Arica, Iquique, Puerto Angamos, Antofagasta, Coquimbo and Valparaíso (/TPV). The adverse sea conditions are impacting vessel movements and cargo handling activities, with delays and reduced productivity expected until conditions improve. Further disruptions remain possible should the swell persist.
Venezuela
La Guaira: Operations are heavily disrupted due to the earthquake last week.
Seaexplorer has four port statuses that are estimated based mainly on the 7-day average vessel waiting time. Other factors include yard congestion, labour strikes, natural disasters or intermodal disruptions.
Slightly different rules are applied to major ports, or ports that are hubs in their region, as they are typically more efficient.
Mainline container vessels may spend a certain number of days waiting at designated anchorage areas before their scheduled port call.
To calculate the 7-day average waiting time, we consider the waiting days of these vessels, excluding:
This rolling average is based on the last 7 days of data and is updated daily inseaexplorer. To find the latest waiting time for a port, enter the port name or code in the search bar and select the relevant option.
Stay Ahead, Stay Informed:Register forseaexplorerfor the latest disruptions and vessel waiting times at global container ports.


